Featured Releases
Displaying 1-10 of 75 Visualizations
-
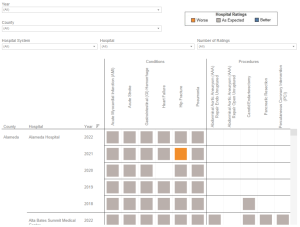 Inpatient Mortality Indicators
The Inpatient Mortality Indicators (IMIs) are measures for certain procedures and medical conditions where evidence suggests that high mortality rates...
-
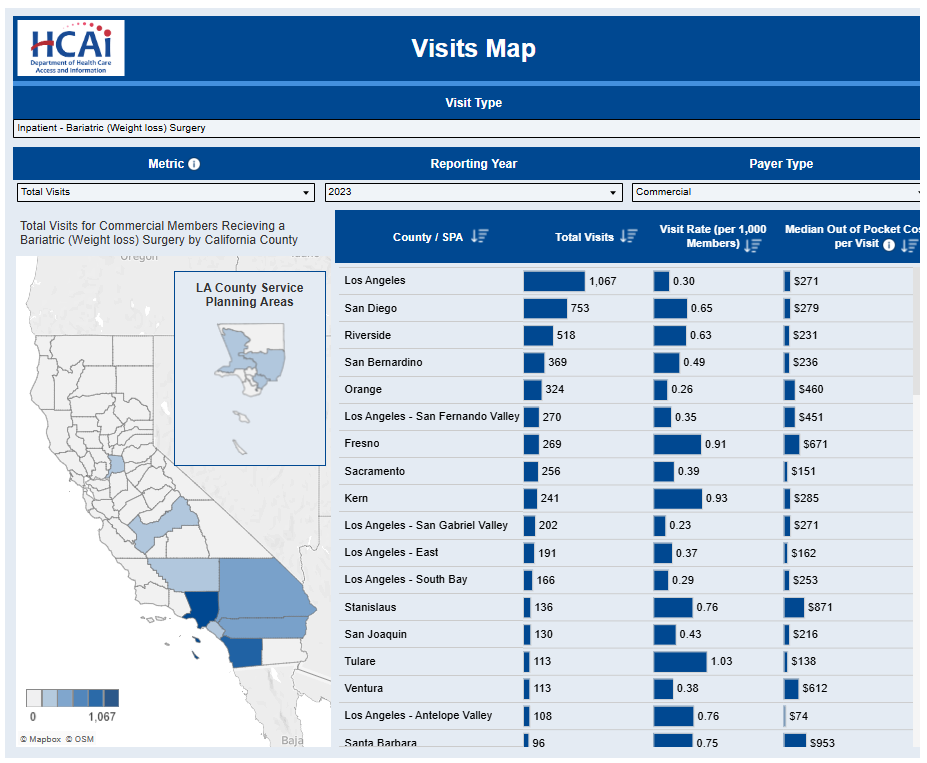 Healthcare Payments Data (HPD) Inpatient Stay and Outpatient Visits Report
The Healthcare Payments Data (HPD) Inpatient Stay and Outpatient Visits Report allows users to explore the most common types of...
-
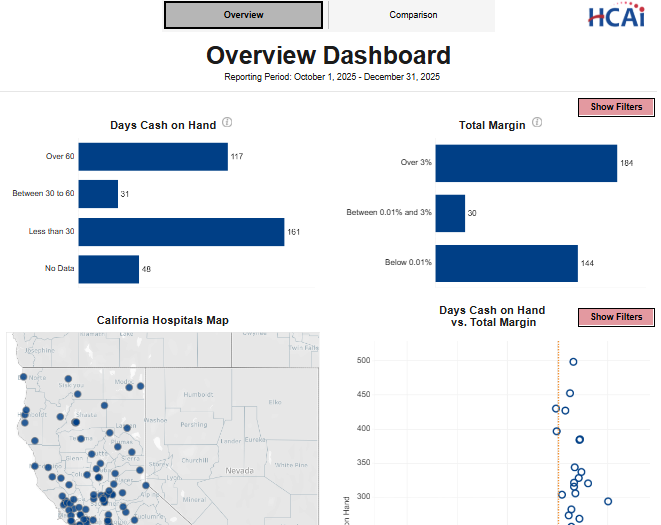 Financial Health of California Hospitals
The California Hospitals Financial Health visualization provides timely, transparent information on the financial status of California hospitals.
-
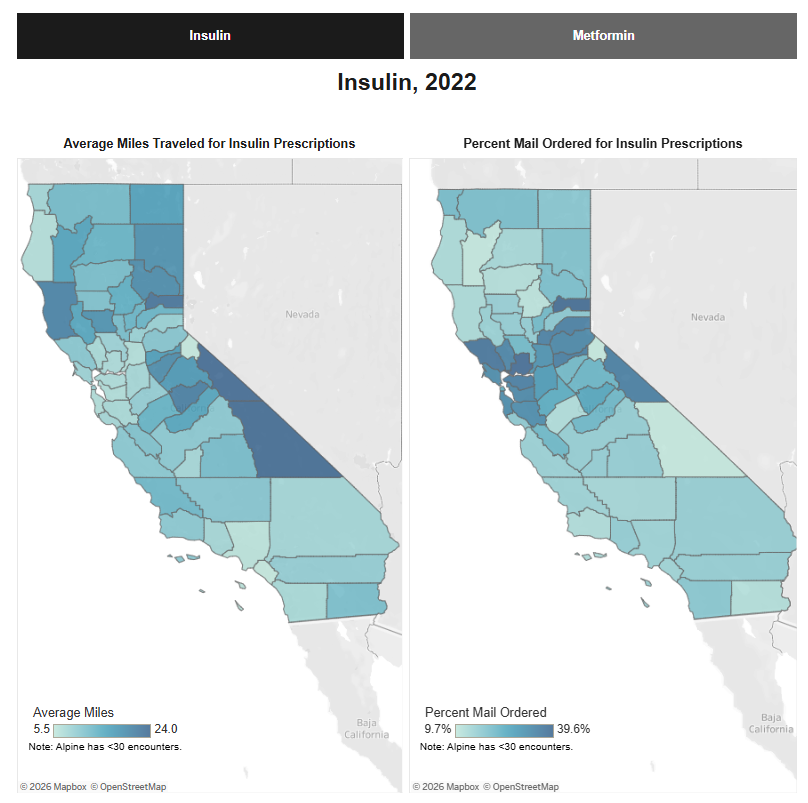 Data Brief: Insulin and Metformin Geographic Access and Mail‑Order Use
A county‑level California map illustrating distance traveled and the percentage of mail‑order use for insulin and metformin.
-
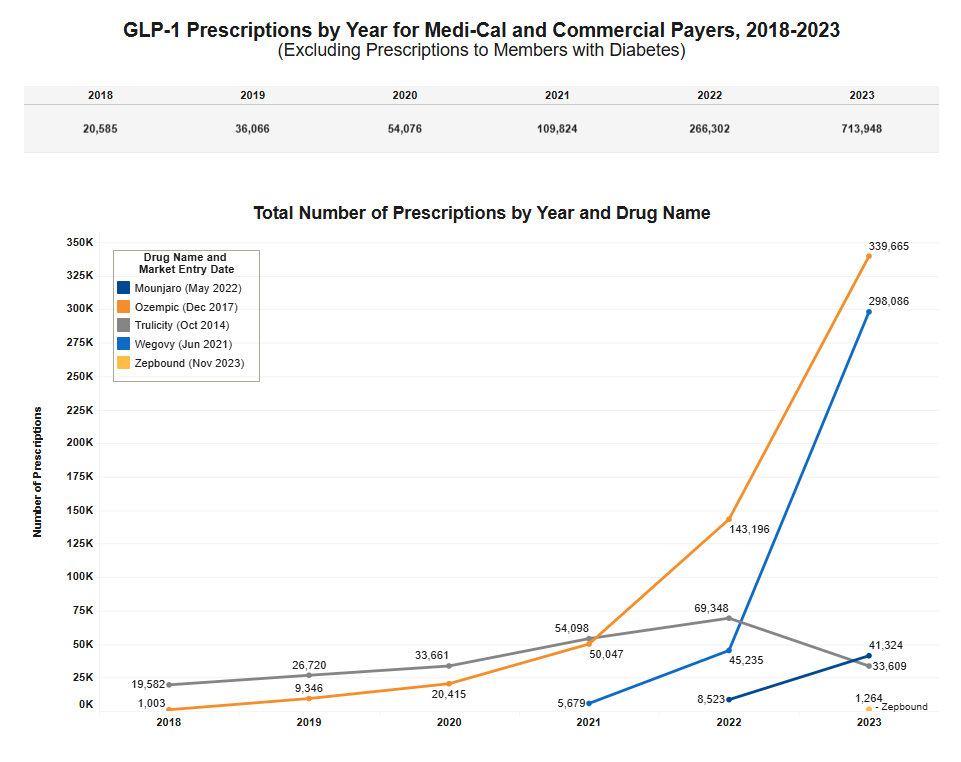 Data Brief: GLP-1 Prescriptions for Weight Loss over Time, 2018-2023
The number of GLP-1 prescriptions for weight loss in California in 2023 was over 34 times greater than in 2018....
-
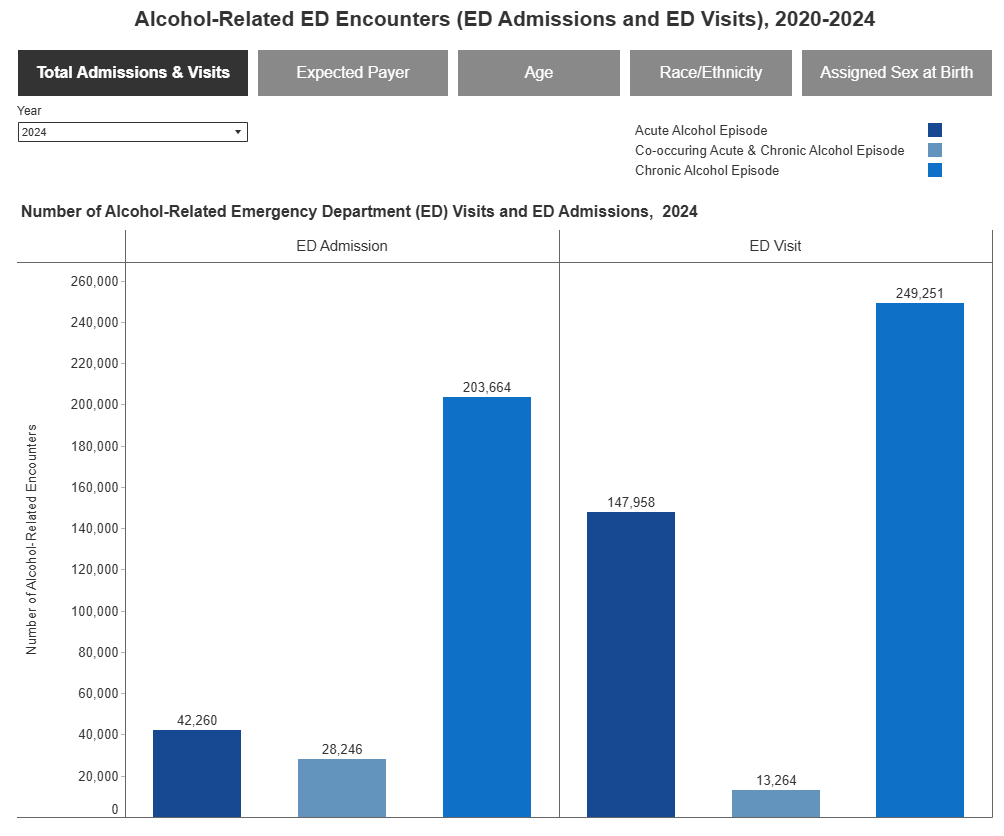 Alcohol-Related Emergency Department Encounters in California
A visualization examining alcohol-related ED visits and admissions by various social demographics from 2020 through 2024.
-
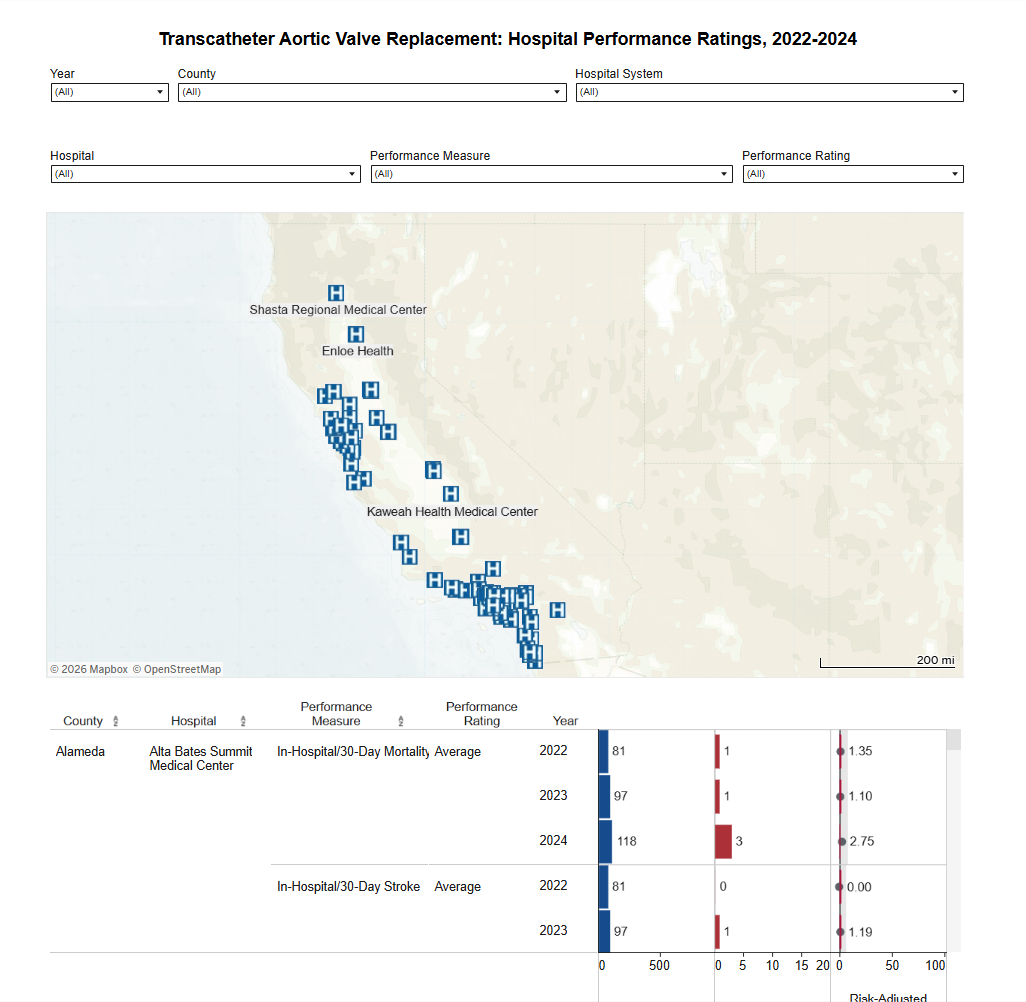 California Transcatheter Aortic Valve Replacement (TAVR) Outcomes Report
This report gives hospitals performance measures to evaluate their TAVR care and quality improvement efforts, while helping payers, employers, and...
-
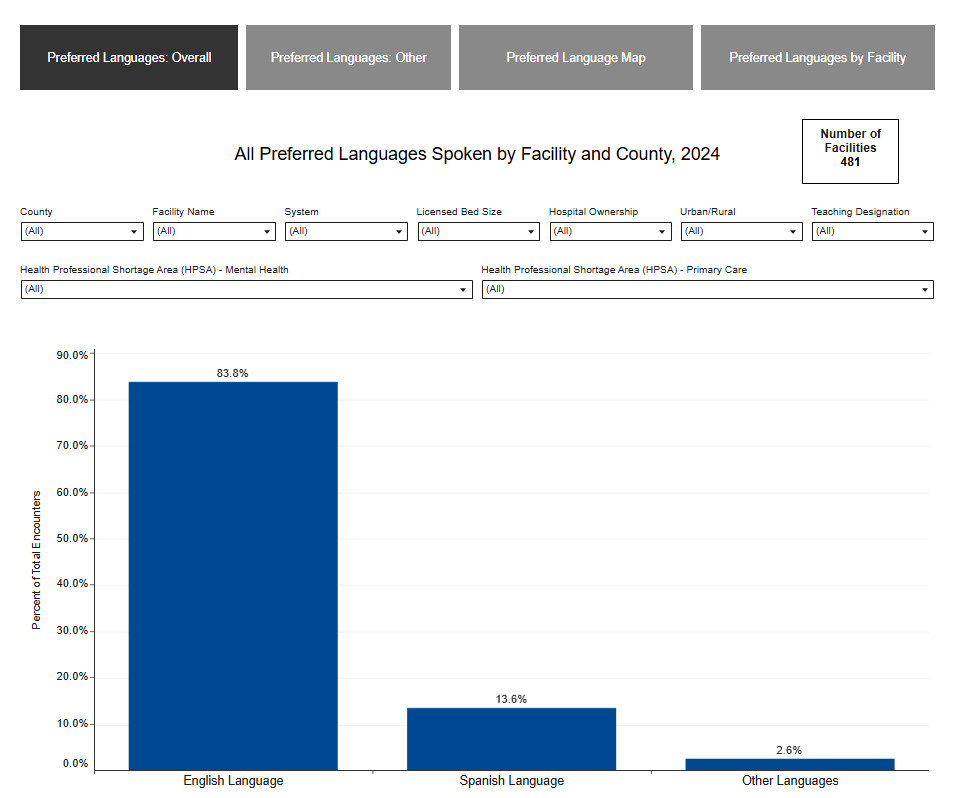 Preferred Languages Spoken in California Healthcare Facilities
Out of 19 million patient encounters statewide in 2024, patients in over three million encounters (16.2%) preferred a language other...
-
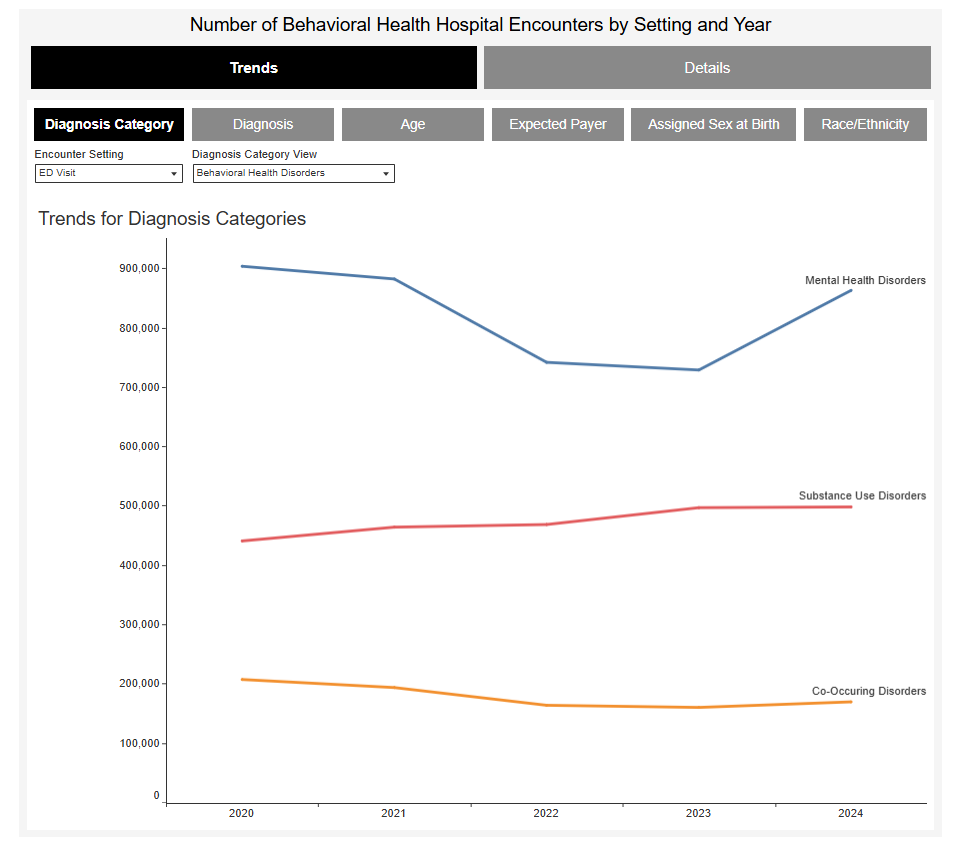 Inpatient Hospitalizations and Emergency Department Visits for Patients with a Behavioral Health Diagnosis in California: Patient Demographics
The number of hospital encounters with a behavioral health diagnosis increased by almost 165,000 from 2023 to 2024, with Mental...
-
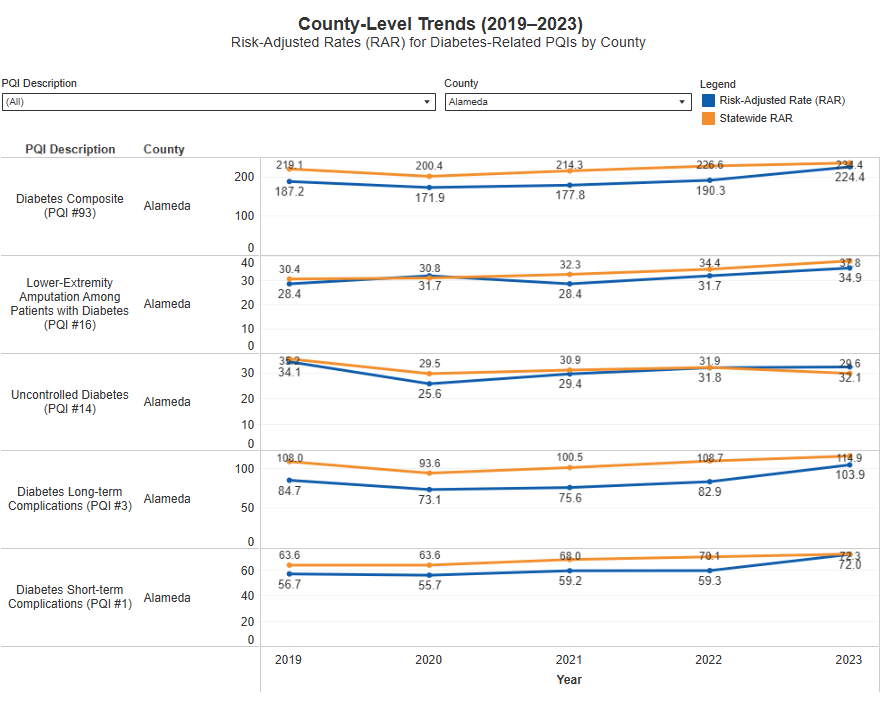 Preventable Hospitalizations for Diabetes
Data visualizations capturing the importance of PQIs in measuring potentially avoidable hospitalizations for diabetes-related conditions.