
Wholesale Acquisition Cost (WAC) Increase Report Data – Current Year
Throughout 2025, multi-source drugs consistently surpassed the yearly median of 22.6% across nearly all price tiers and source types. The sole exception was innovator multi-source drugs with WAC>$10,000. In contrast, all single-source drugs stayed below the yearly median.
HCAI collects and publishes information on prescription drugs when a Wholesale Acquisition Cost (WAC) increase exceeds two thresholds – the WAC (after the increase) is greater than $40 for a course of therapy, and the WAC increase results in a greater than 16% cumulative increase inclusive of all WAC increases in the current calendar year and the two previous calendar years.
The visualizations below include submitted WAC increase data from Q1 2025 through Q4 2025. These graphs display data that shows Median Cumulative WAC Percent Increase by WAC Price Category, Drug Source Type, or Both. The visualizations allow you to filter through the data by quarter.
- Learn more about the Prescription Drug Cost Transparency Program
- View other Prescription Drug Cost Transparency Public Reports
Median Percent Increase – WAC Price Category
Key Findings
- The highest median cumulative WAC percent increase, for a specific price category, occurred in Q2 2025 for prescription drugs with a WAC = $250 to $1,000.
- In Q1 2025, prescription drugs with a WAC > $10,000 experienced the lowest median cumulative WAC percent increase (19.9%) compared to all other categories.
- In Q2 2025, prescription drugs with a WAC = $250 to $1,000 (63.3%) and a WAC > $1,000 to $10,000 (34.2%) recorded their highest median cumulative WAC percent increase since reporting to HCAI began in 2019.
Median Percent Increase – Drug Source Type
Key Findings
- In Q1 2025, Single Source Drugs saw the lowest median cumulative WAC percent increase (20.0%) of any quarter.
- In Q4 2025, Non-innovator Multiple Source Drugs recorded a 123.8% median cumulative WAC percent increase, representing the highest surge in a single quarter.
Median Percent Increase – WAC Price Category & Drug Source Type
Key Findings
- In Q2 2025, Non innovator Multiple Source Drug with WAC>$10,000 also had the largest median cumulative WAC percent increase in price category and drug source type.
- Throughout 2025, multi-source drugs consistently surpassed the yearly median of 22.6% across nearly all price tiers and source types. The sole exception was innovator multi-source drugs with WAC>$10,000. In contrast, all single-source drugs stayed below the yearly median.
CTRx Term Definitions
Wholesale Acquisition Cost
Wholesale Acquisition Cost (WAC) is defined in the U.S. Code as “…the manufacturer’s list price for [a] drug or biological to wholesalers or direct purchasers in the United States, not including prompt pay or other discounts, rebates or reductions in price…”
National Drug Code (NDC)
The pharmaceuticals industry assigns a unique three-segment number, called the NDC, to each drug product manufactured and sold. NDCs must be provided to the federal Food and Drug Administration (FDA), and are used for ordering, billing, inventory management, and recalls.
HCAI requires that relevant reporting uses the 11-digit format of the NDC. The three-segments of the format can be broken into the following:
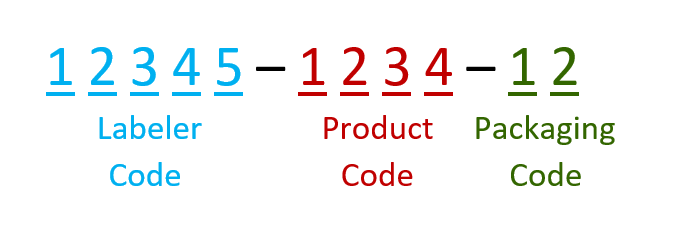
The labeler code, also known as the manufacturer code, identifies who manufactures, repacks, or distributes a given drug product.
The product code identifies the drug, its strength, dosage form, and formulation specific to the firm that manufactures the given drug product.
The packaging code typically identifies the number of product units in the given product (package size), but also may indicate the type of packaging used.
How HCAI Created This Product
Prescription Drug WAC Increase data for 2025 from the Cost Transparency: Prescription Drug Program (CTRx).
Note: Reported increases that do not meet the statutory requirements for reporting and prescription drugs that do not meet the definition for reporting under the program regulations and Section 321(g) of Title 21 of the United States Code were not included in the visualizations. Submitted reports not meeting statutory requirements were 49 of 1,343 (3.7%) in 2025. In addition, approximately 46.8% of reports in 2025 did not include any reason(s) for the reported WAC increases due to the information not already being in the public domain.
Resources
Note:
- The 3-year median percent increase is based on submitted WAC increase data. The dataset is subject to reporting.
- The dataset includes only complete reports submitted by manufacturers for WAC increases made in 2025 and does not include reports that do not meet the specified minimum thresholds for reporting.
- Data from reports submitted after April 17, 2026, is not represented in the visualizations.
Additional Information
Topic: Cost Transparency
Source Link: Cost Transparency – Prescription Drug (Rx) Costs
Citation: HCAI – Prescription Drug Cost Transparency, 2025
Temporal Coverage: 2025
Spatial/Geographic Coverage: Statewide
Frequency: Annually